|
|||||||||||||||||||||||


 |
|||
|
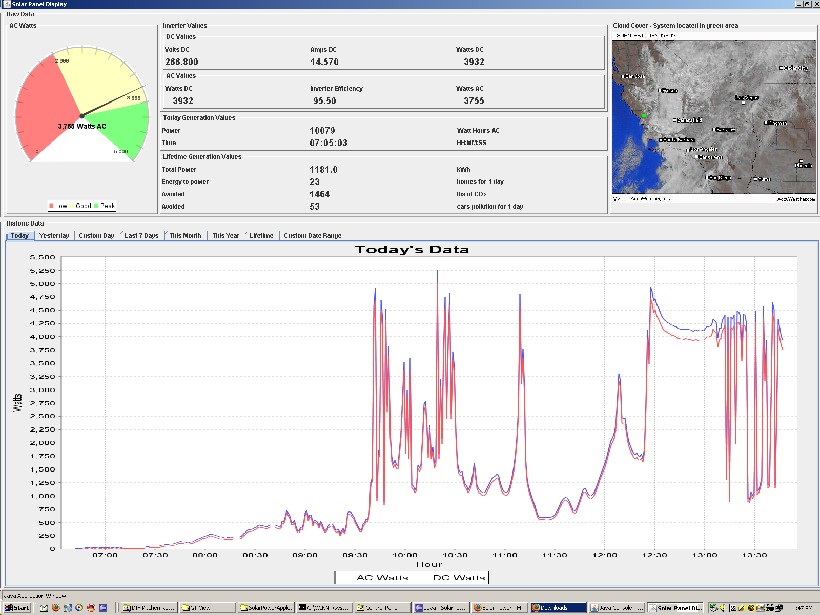
I wrote a detailed solar power data display application to show the details about my solar power system back in California. Unfortunately the Internet has deprecated the method I used to run the applet within this web page, and the system has been dismantled and sold, so I can only show you a screen capture. |
|||
 |
|||
|
Note that it's a Java application (not applet) that your web browser launches using Sun's Java Web Start technology. The following steps take place when you click the screen shot above: 1) Your web browser loads the Java application launch description file (.jnlp) from this web server. Some interesting things about the application: * I don't read or write any data from your local system. I don't need to, and the Java security mechanisms wouldn't let me. If you have any comments or suggestions, please email me at mwbrown42 at gmail dot com.. |
|||
|
Solar Power Background I moved to Paso Robles, California in June 2007. "Paso" is on the Central Coast, halfway between Los Angles and San Francisco, in the middle of a large winery region. The grapes like this area because of the warm days and cool nights. Paso gets over 300 sunny days per year so about 6 months before I moved, I started planning the installation of a solar power system. I try to do what I can for the environment, including using only Compact Fluorescent bulbs, recycling, using less, reducing greenhouse gas generation, running B-20 biodiesel and generally being smart about my impact. I think it makes a lot of sense to generate electricity from the sun, if you have a suitable climate, good installation location and the significant money to spend up-front, for a long-term payoff. With the system in place, I can follow my plan to migrate to an electricity-only property, changing from a propane tank and propane appliances to a tankless electric water heater, electric stove and electric heating system. And maybe an electric car someday to get me 10 miles into town and back... This plan was further reinforced by the stories of rolling blackouts and Enron price-fixing in the electricity market here in California This is what I'm trying to avoid; check your electricity cost and let me know how it compares. (kW = thousand watt-hours consumption). Pacific Gas & Electric has a staggered monthly rate schedule (E-1 for normal households) that currently goes (approximately) like this. The lower tiers' prices have been stable for a while, but the higher tiers are expected to increase. 0-400 kWh: 11 cents / kWh Looking at my last full Austin electric bill (May/June 2007 with the air conditioner running) of 1725 kWh , I paid $173, including fees and taxes. Here, that would have cost me $388.25, without fees and taxes. I have a lot of computers and woodworking tools and I don't look forward to bills like that every month. So the decision was pretty easy. I did some research and everything pointed to hiring REC Solar, based in San Luis Obispo, to design and install the system. Les Kangas is the REC sales rep for my part of Central California. After a lot of emails back and forth and several visits to my house, we agreed on a strategy and component suppliers as follows: 25 Sanyo 200W panels Best in the heat of the north county, and most efficient power conversion
This delivers a 5000 watt system, a good size for my expected usage. We chose an inverter sized for the maximum panel output, but in the future I can bolt on more panels and buy another inverter. I had thought to buy two 3800W inverters now, sized for a 50% capacity upgrade, but in the early morning and late evening the panels may not be able to supply the minimum power required to drive the inverter efficiently. Also I would be putting money into extra inverter capacity when in fact I may be happy with the 5000W system. I will not have a battery bank as I don't feel the need to be totally "off-grid", plus the batteries and the charger are expensive and the batteries lose their capacity over time. During the day as I generate more than I use, my excess power goes out onto PG&E's grid and my electric meter spins backwards. At night as I draw power, the meter spins forward. On the 12 month anniversary of the go-live date, I pay a single bill for my "net" usage, but I do have to pay $4.44 per month for the privilege of being connected to the grid. Unfortunately if I generate more power than I consume, PG&E doesn't write me a check. The goal is to size the system so I'm safely in the lowest bracket. It makes little sense today to generate 100% of your expected usage if you want to be tied to the grid for power at night, as no solar system can generate power that's cheaper than that lowest bracket. The total cost of the system wasl $47,133, offset by an $11,042 rebate from PG&E and a $2,000 U.S. Federal tax credit that I can take on my 2007 tax return. Later, if I buy more panels to bump up my capacity, the PG&E rebate will be lower, an incentive for people to install systems now. The timeline of the project was: Complete July 2007: REC Solar rep and I finalize generation size, panel and inverter components |
|||